
Reports
What each Reports tile totals, how to change the period and filters, and how to arrange the tiles.
On this page
The Reports tab turns your logbook into totals and charts. Pick a period with the chips at the top, tap a tile to open it, and use Filter to narrow what is counted.
What counts in the totals #
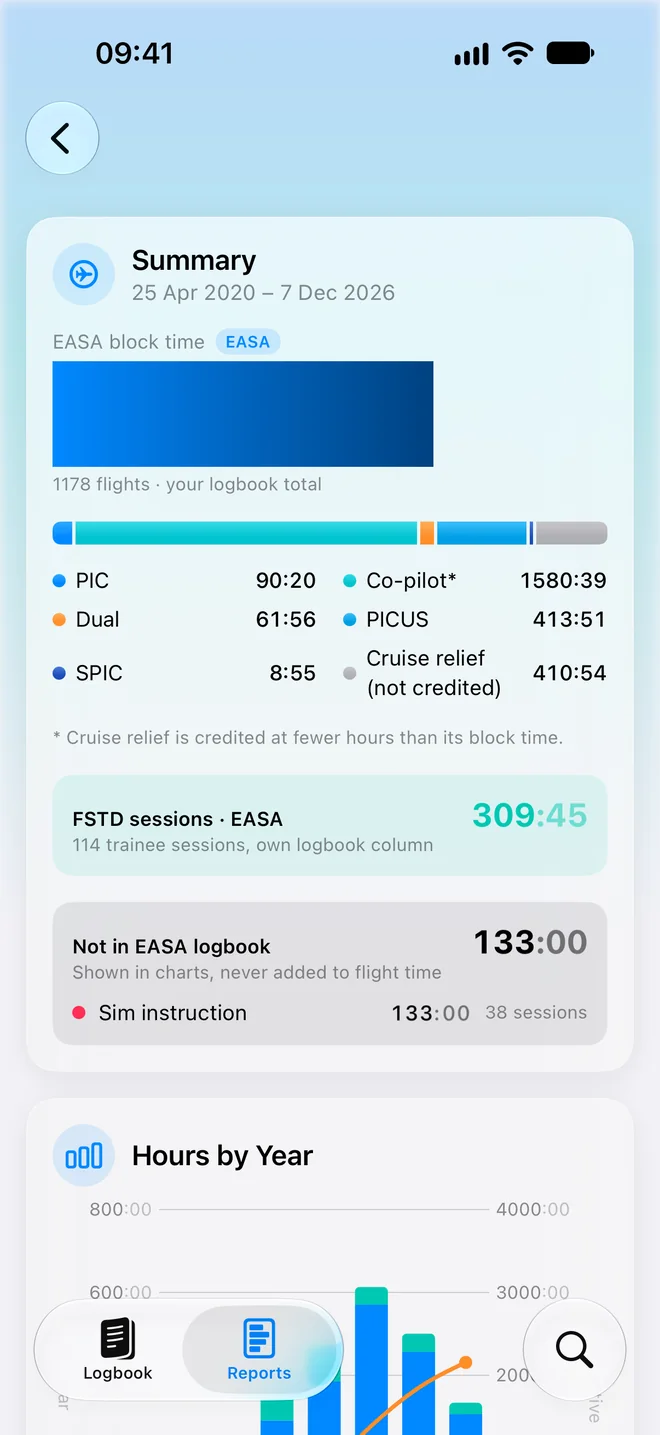
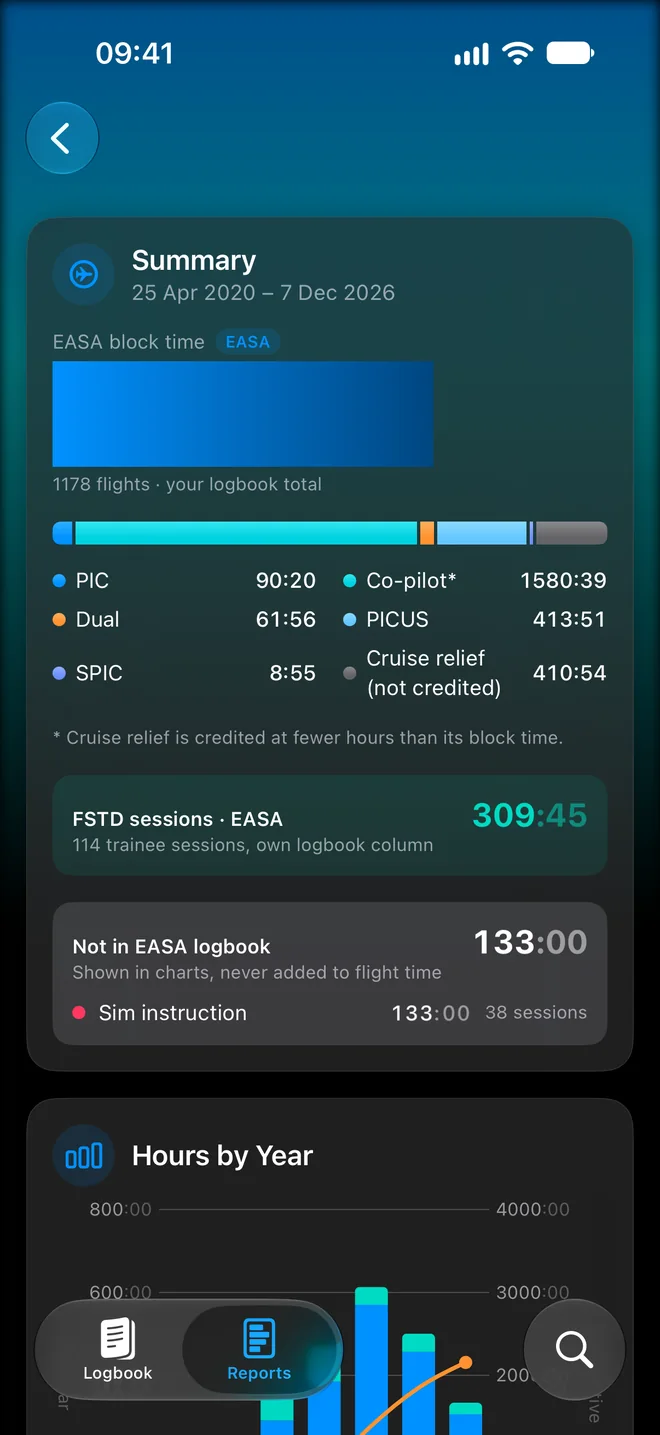
Reports total EASA block time. A flight that has not been flown, so it has no block time yet, is in no total. Simulator sessions and brought-forward rows are counted.
Change the period #
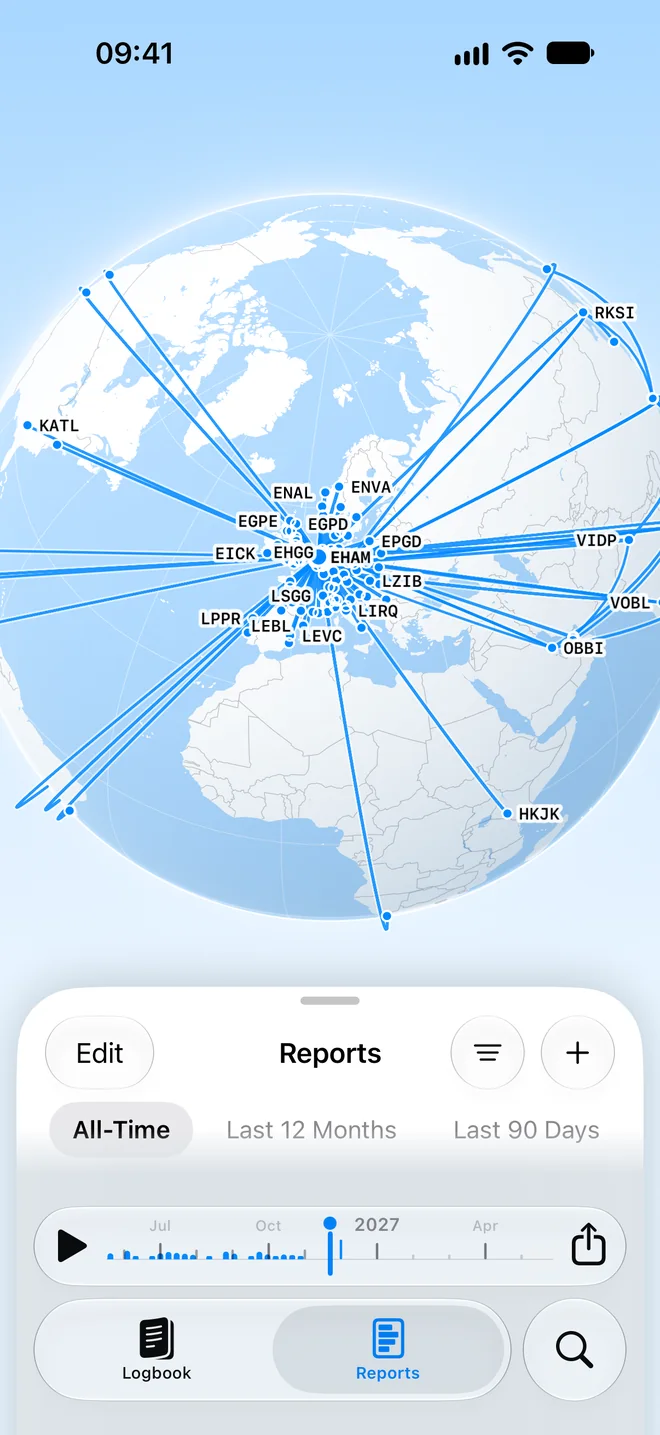
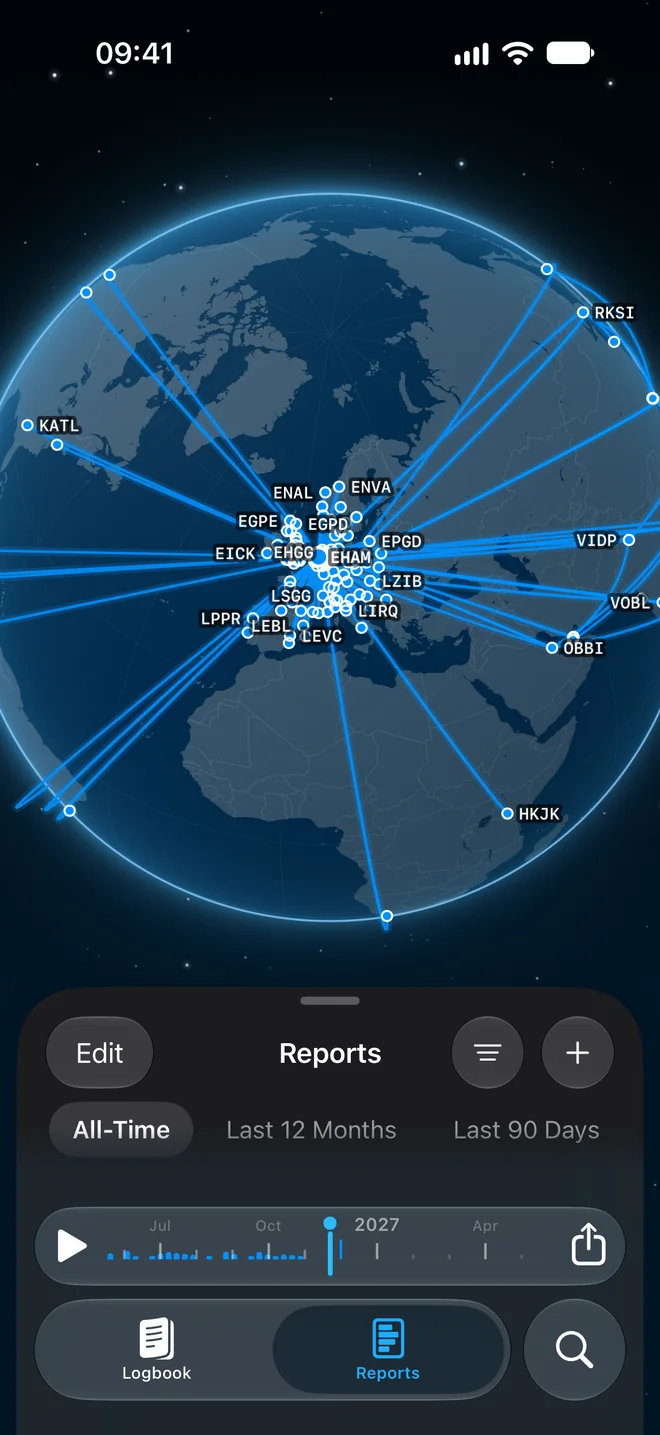
The chips at the top are All-Time, Last 12 Months, Last 90 Days, and then each year in your logbook with flights, newest first. Tiles, the map and the Flight Passport follow the chip. The ATPL progress tracker always counts your whole career.
Filter the reports #
- Tap Filter in the Reports panel.
- Set one or more of: Date, Type, Roles, Individual roles, Crew, Flight rules, Aircraft Types, Registration, Departure, Arrival, Session type, FSTD device, Imported Logbook Records, Takeoff, Landing, Issues.
- Close the filter.
The filter icon then fills in and a Filters applied chip appears. Tap the chip to clear every filter except the period.
The tiles #
| Tile | What it totals |
|---|---|
| Passport | Flights, distance, flight time, airports, airlines, countries and personal bests. See Flight Passport and the map. |
| Currency & Medical | Take-off and landing currency, autolands in the last 6 months, flight time limits and your medical. See Currency, medical and flight time limits. |
| ATPL Progress | Hours toward the ATPL(A) requirements. See ATPL progress tracker. |
| Flight Time | Total logged, hours by month or year, air and taxi time, night, IFR, simulator, passengers carried, day and night. |
| Crew | Who you fly with most, highlights and loyalty. |
| Roles & Experience | Hours by role, instructor hours and the mix of PIC, PICUS, SPIC, co-pilot, dual and instructor. |
| Takeoffs & Landings | Take-offs, landings, landings over time and approaches. |
| Aircraft | Hours by type, aircraft and flight rules, and your most-flown aircraft, by time or by number of flights. |
| Places & Distance | Distance, longest sectors, sector lengths, countries, busiest airports and top routes. |
| Operations | On-time performance, fuel and fuel efficiency, passengers, and an estimate of CO2. |
| Simulator | FSTD sessions and their types. |
Cards without data stay hidden.
Share a tile as an image #
Tap the share button on a tile, check the Preview, then tap Share. Inside a tile, press and hold a card and choose Share as Image to share that card.
Arrange your tiles #
- Tap Edit in the Reports panel.
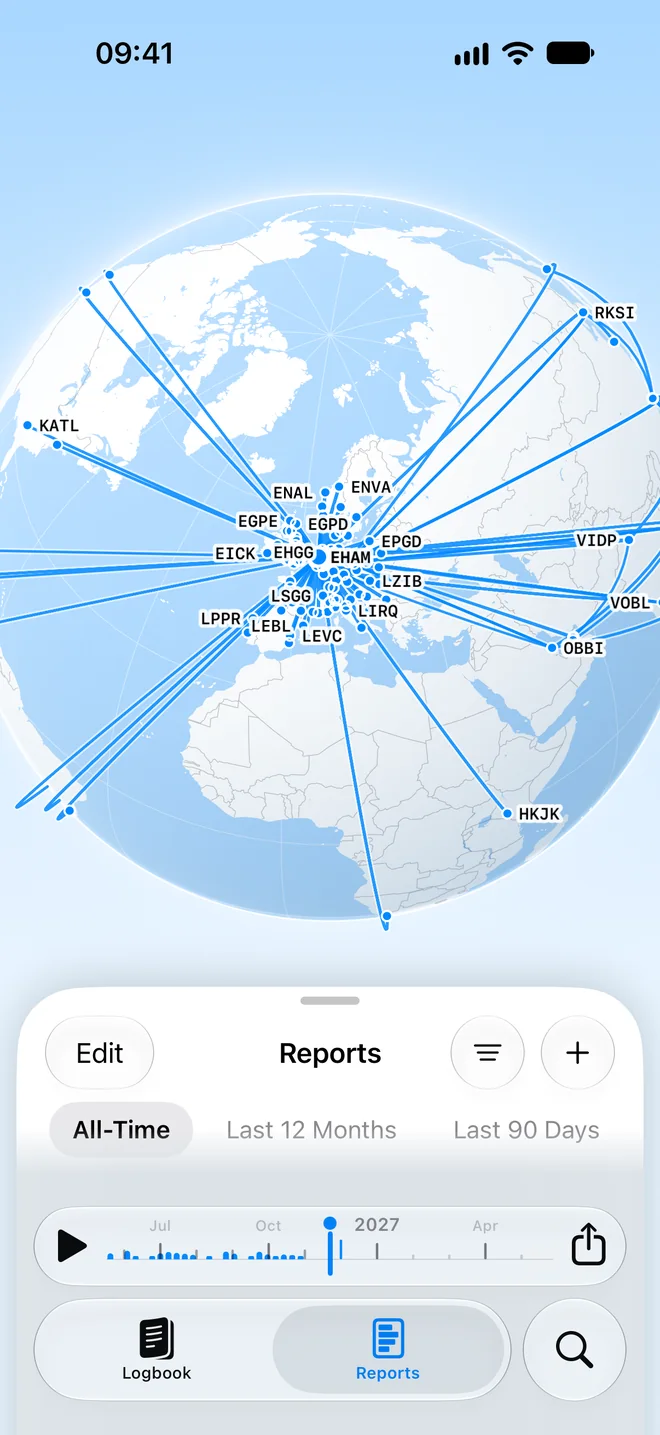
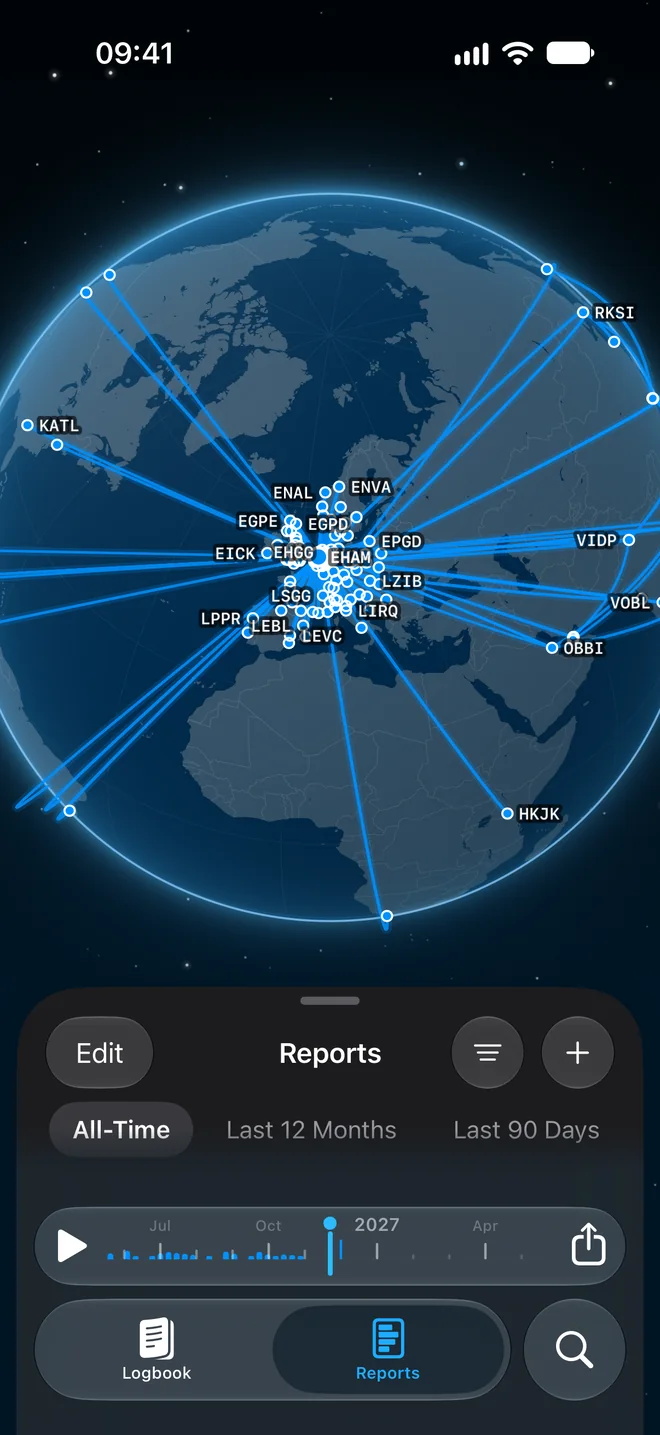
- Drag the tiles under Shown to reorder them. Tap the minus to hide a built-in tile or remove one you added.
- Tap Reset to Default to go back to the original layout.
To add a tile, tap Add to Reports and choose a tile or chart. You can add one for a specific filter and period, for example A320 approaches. A tile's menu also has Move to Top, Move Up, Move Down, Hide and Delete.
On iPad the Reports map opens with the sidebar hidden. The sidebar button on the map brings it back.
Still stuck? Write to support and a pilot answers.